Chronic diseases have a widespread impact on health outcomes and medication adherence is one main factor to improve the health status. Based on medical claims data hold by medical insurers or management services, adherence patterns of members with chronic diseases, such as type2 diabetes or cardiovascular disease can be identified based on their diagnosis claims (ICD codes), and related prescription claims with their days-of-supply information for fills of a given drug in a particular time period. Assessing these prescription claims, the adherence to a specific drug or drug-class can then be calculated through the proportion of days covered (pdc).
We generated a python based programming solution, computing pdc medical adherence on a patient basis, per drug and per year. The data is plotted using the python library bokeh – also allowing for the generation of interactive displays (bokeh server). Some outputs are shown below.

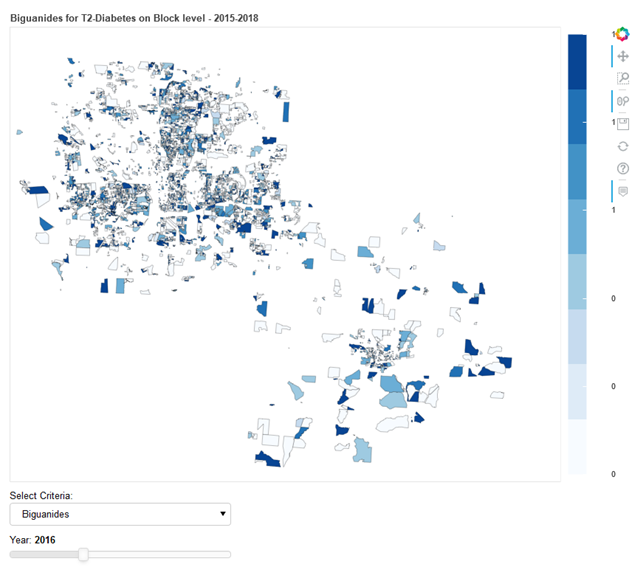
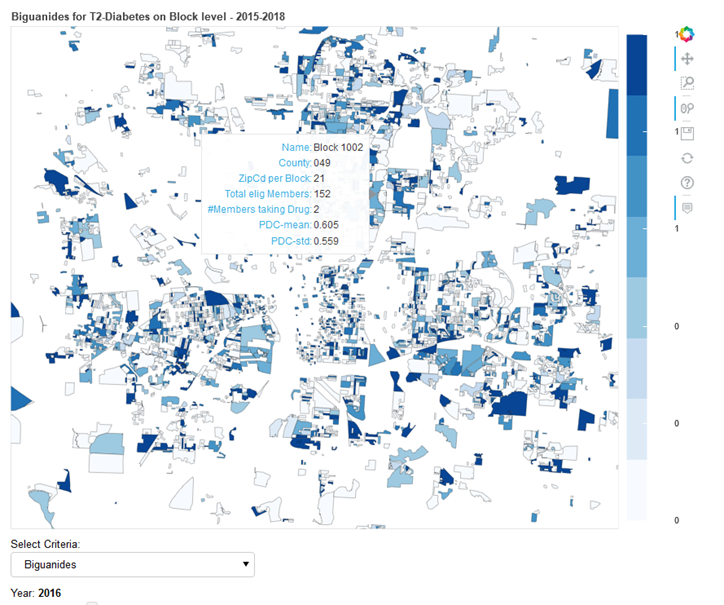
Further, python bokeh is employed for producing a web-based interactive map output, illustrating aggregated medical adherence data (pdc) per drug-class on a census unit level: The application below enables the user to select a specific drug-class, and setting the year of analysis with the time-slider.

Zoom into the feature map is possible, and census units reveal feature information when hovering over.


