
We looked at whether living in well-interconnected neighborhoods impacts the structure of the hippocampus in older adults. We analysed structural brain imaging and residential environment data from over 500 community–dwelling older adults (>70 years old) living in Sydney/AU.
The results and the publication (03/2026) can be found in cities nature.com.
Category: GIS updates
Brain health: Neighborhood street connectivity and
Physical activity patterns and environmental influences: Findings from the Kuwait diabetes epidemiology program
The collaboration with the Kuwait Dasman Diabetes Institute (DDI) making progress. A cross-sectional study looking at physical activity (PA) of Kuwaiti adults in the years 2011-2014 (WHO based questionnaire) reveals that half of the cohort population did not meet the WHO recommended minimum PA level. Efforts to promote PA in Kuwait should consider addressing gender and ethnic disparities, local environmental factors, and demographic influences.
See the article here.
Do associations of neighbourhood attributes with cognitive function vary by socio-economic status ?
All indicators of higher socio-economic status (SES) relate to better cognitive health: Socio-economic status (SES), neighbourhood environments and their interactions can influence cognitive health in late life. Studies on this topic have examined a limited number of SES and environmental indicators and are mostly cross-sectional. We analysed data from 1160 individuals aged 60–64 years at baseline, with four assessments of cognitive functions across 12 years.
Article: Do associations of neighbourhood attributes with cognitive function vary by socio-economic status? A 12-year follow-up study of older Australians (2025); In: Science of The Total Environment, Vol. 999
Neighbourhood environments and transition to cognitive states
Neighbourhood built and natural environmental correlates of transition to dementia: associations with cognitive state and transitions – when assigned with spatial analysis work at ACU Melbourne we contributed to the findings, published in this article.
Neighborhood environments and transition to cognitive states:
Sydney Memory and Ageing Study;
in: Alzheimers & Dementia: The Journal of the Alzheimers Association
Neighbourhood environments and cognitive health
Neighbourhood environmental correlates of transition to mild cognitive impairment (MCI): Published results from our long-term effort, looking at environmental influences on cognitive health (longitudinal study) in the journal Environment International.
Graphs using Highcharts
Our work with Health Research Institute of University of Canberra involved designing an interactive Sankey diagram. We chose the Highcharts JavaScript library.
Below Sankey chart shows residential moves registered in a U.S. state within neighbourhoods assigned with a socioeconomic disadvantage index
(Ref. see Neighbourhood Atlas). This Area deprivation index is mapped on U.S census blockgroup level. The lines in the grapph below represent moves between classes of deprivation scores, from one area (on left) to another (on right).
The analysis includes 93,706 moves in total.
Point in Polygon – Vertica
We used AU nation-wide 2021 GNaf address points (n 15,150,683), and 2021 meshblock polygons (n 368,255) – attributing each point with a meshblock attribute. Runtime: 104 seconds
Steps:
Create spatial tables, e.g. with SELECT STV_ShpCreateTable ( USING PARAMETERS file = '/data_au/MB_2021_AUST_GDA94.shp') OVER() AS spatial_data;
copy data:COPY data_au.mb_2021_aust_gda94 WITH SOURCE STV_ShpSource(file='/data_au/MB_2021_AUST_GDA94.shp', SRID=4283) PARSER STV_ShpParser(); EXCEPTIONS 'data1/vertica_data/exceptions_ralf'; commit;
We can pull the points file (with x/y coordinates):copy data_au.aus_gnaf_aug21 from '/data_au/aus_gnaf_aug21_prem_2021.csv' PARSER fcsvparser(header=true);
and add geometry:alter table data_au.aus_gnaf_aug21 add column geom geometry;
UPDATE data_au.aus_gnaf_aug21 SET geom = STV_GeometryPoint(lon, lat, 4283); commit;
Create spatial index for the polygon data; set ram-memory to 10 gig
(default 256 mb); we use the mb_code created as integer column:SELECT STV_Create_Index(mb_code_int, geom USING PARAMETERS index='mb_index', overwrite=true, max_mem_mb = 10000) OVER() FROM data_au.mb_2021_aust_gda94;
Perform point in polygon selection: (point id has to be unique & integer):SELECT STV_Intersect(id, geom USING PARAMETERS index='mb_index') OVER (PARTITION BEST) AS (point_id, polygon_gid) FROM data_au.aus_gnaf_aug21
We can re-run and join using gnaf_pid to get point_ids with mb_codes, this time we also account for invalid point data (where-clause):Select aa.gnaf_pid, polygon_gid as mb_code_int from data_au.aus_gnaf_aug21 aa
join (
SELECT STV_Intersect(id, geom USING PARAMETERS index='mb_index') OVER (PARTITION BEST) AS (point_id, polygon_gid) FROM data_au.aus_gnaf_aug21
where not (geom is null or id is null)) bb on aa.id=bb.point_id
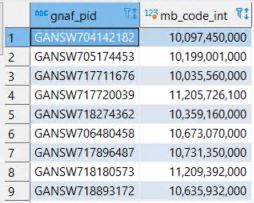
Results:
Urban planning support –
Implementing the 20-minute neighbourhood concept (Melbourne and Adelaide)
After a few years of data compiling, and analysis – a further paper is now published supporting urban planning – for integrating a 20min neighbourhood strategy. It ensures that people have the aility to meet most of their daily needs within a 20-minute walk/non-motorised trip from their home. It is already part of the planning policies of some city councils.
See the article in the Int. Journal of Behavioral Nutrition and Physical Activity of the project lead by Deakin University (IPAN).
See concept maps online: Melbourne and Adelaide

Geographic variation in and contextual factors related to medication adherence with type 2 Diabetes
Another publication of our collaborative work with spatial and multi-level analysis has been accepted.
This research applied geospatial techniques to explore small area geographic variation, spatial clustering, and spatial convergence in medication adherence to diabetes medication. This enabled an examination of where populations at high risk of non-adherence are concentrated.
It is available here.
Re-ranking of Socio-Economic Indexes for Areas (SEIFA)
Our paper is finally out.
We examined whether Socio-Economic Indexes for Areas (paricularly, the Index of Relative Socioeconomic Disadvantage – IRSD) should be based on a more locally sensitve indicator, in contrast to the existing national and state-based rankings. This aims to develop more suitable rankings, esp. for regional areas.
Please see our article in the Journal of Australian Population Studies.